
The consolidation of Monday has been a platform for the dollar bulls just to get ahead slightly today. The question is whether it is a move that will have legs.
There does not seem to be any discernible move higher on Treasury yields, or shift in US interest rate futures that would suggest there has been a notable change on positioning for the FOMC meeting. However, these dollar gains are having an impact on several major markets which are now approaching key crossroads both technically, but also ahead of key fundamental events. For example, EUR/USD is slipping back to test the near term support band $1.1180/$1.1200 that has provided a floor in recent weeks . This is coming ahead of what is going to be a crucial meeting for the ECB this week. The euro has come under pressure with pricing for a deposit rate cut of 10bps in the balance. Cable is falling away again ahead of an announcement of a new UK Prime Minister (expected just before midday UK time today), widely expected to be the more euro-sceptic Boris Johnson. Prospects of a harder “no deal” Brexit that potentially could come with Johnson have weighed on sterling throughout the summer. But we are also seeing a crucial moment for the gold bulls too. Gold has slipped back by over $35 (around 2.5%) since last Friday’s multi-year high and is now testing the bullish outlook.
Wall Street closed mildly higher last night with the S&P 500 +0.3% at 2985, whilst US futures are another +0.1% higher today. In Asian markets, the outlook is also positive with the Nikkei +1.0% and Shanghai Composite+0.5%. European indices are set for decent gains too, with the FTSE futures+0.4% and DAX futures +0.6%. In forex, there is a move back into the dollar which is seen across the major pairs. For commodities, the USD strength is pulling back gold once more, which is around -$7 lower (c. -0.5%), with oil a shade higher.
There is still very little to get the pulses racing on the economic calendar for the European session this morning. It is not until later on when EurozoneConsumer Confidence is released at 1500BST. Consensus is looking for no change in July to remain at -7.2 (7.2 in June) which would further argue that confidence has stabilised in 2019. US data comes with Existing Home Salesat 1500BST where the consensus forecast looking for very little change, with the slightest dip back to 5.33m in June (from 5.34m in May). There is also the Richmond Fed Composite index at 1500BST which is expected to improve slightly to +5 in July (from +3 in June).
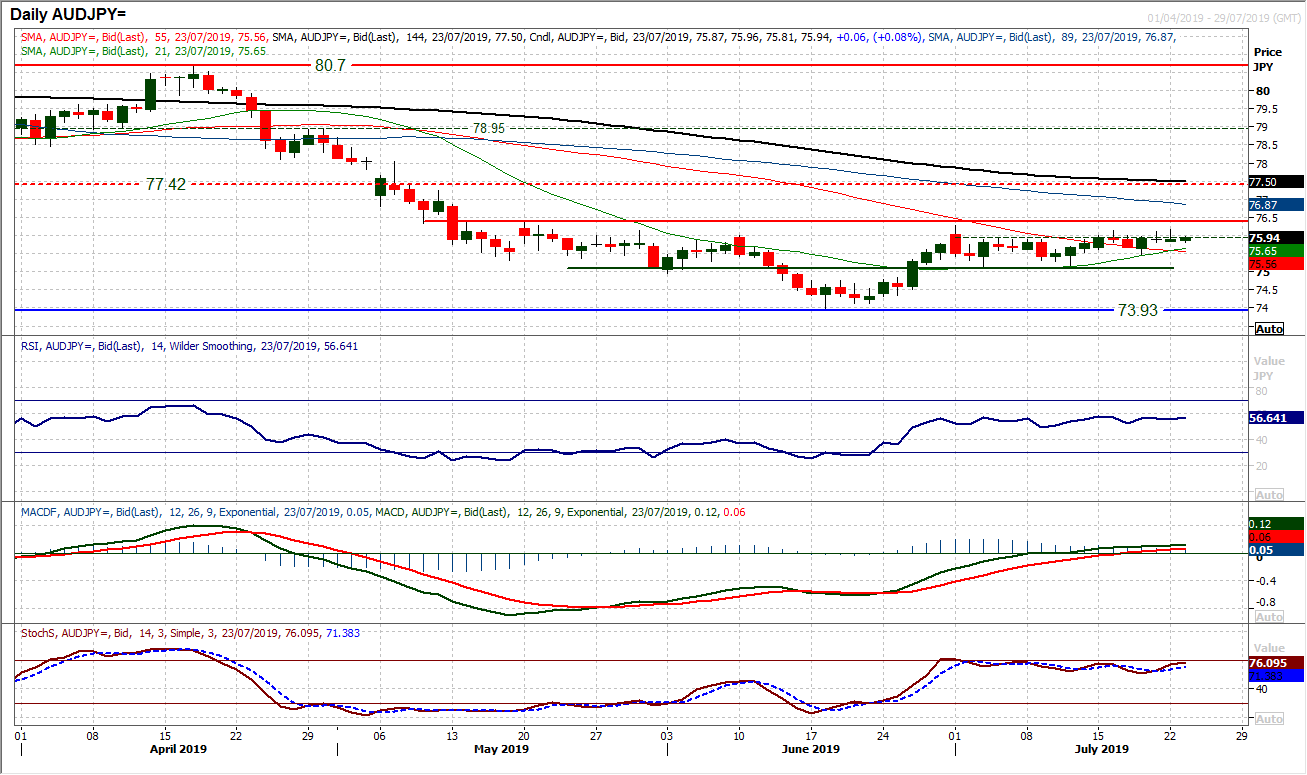
Chart of the Day – AUD/JPY
Aussie/Yen remains one to keep an eye on as the potential for a two month base pattern formation is still live. There has been a degree of consolidation in the past few weeks as the resistance between 76.25/76.40 has remained firm. Can the bulls make the breakout? In recent sessions, the bulls have been consistently pulling to intraday three week highs, but without managing to break free. Once more yesterday, a close above 76.00 (which would be the highest close since mid-May) seemed destined, only for the bulls to have their wings clipped. However, there is positive configuration on momentum which is guiding the market to push for gains. Look for the RSI into the 60s and a closing level above 76.00 to reflect the bulls breaking free. Could this be the time? The hourly chart is suggesting that more needs to be done, but near term weakness is being bought into. The bulls will look to build from a band of pivot support 75.80/75.90, with initial resistance at 76.15. The real signal for a breakout is still a way off, with a move above 76.40 which would complete the 145 pip base pattern. As the improvement has developed in the past week, a higher low at 75.45 has been left.
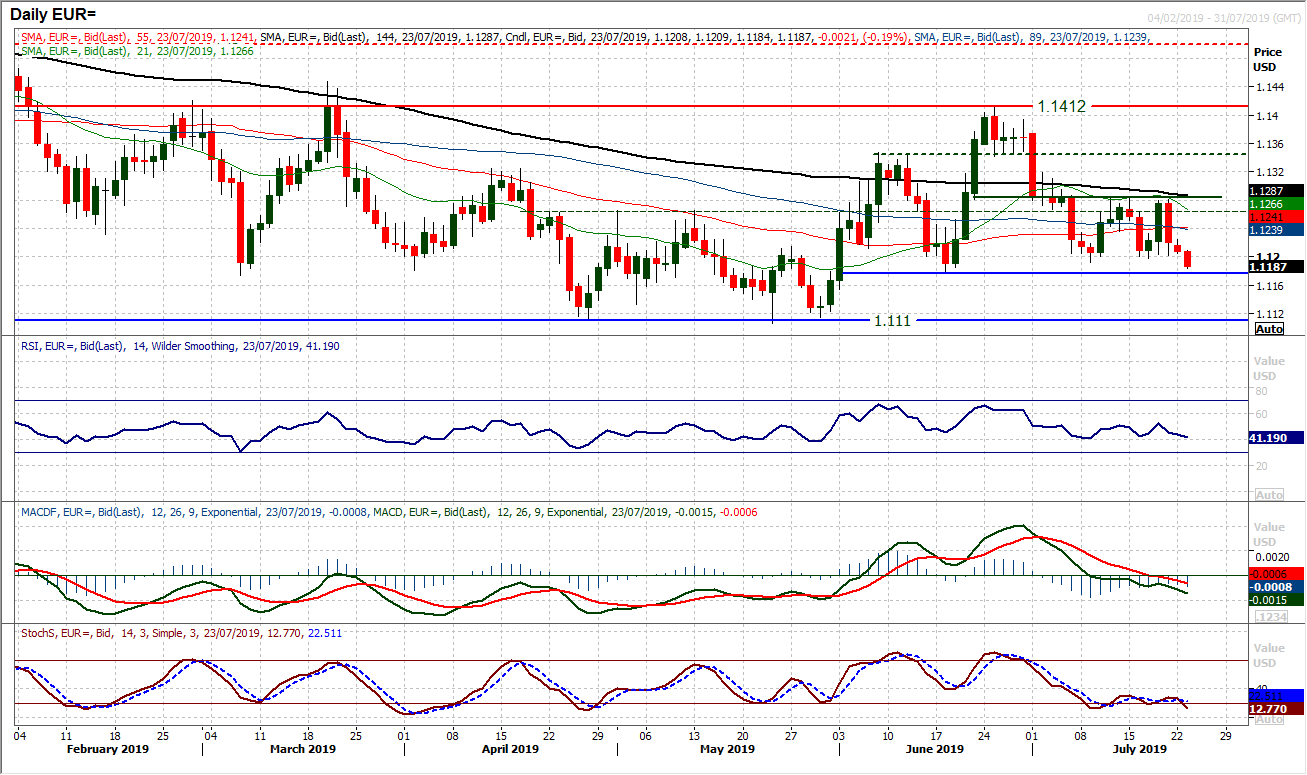
EUR/USD
Could the period of choppy consolidation in the band of around 100 pips between $1.1180/$1.1285 be broken ahead of the crucial ECB meeting? The support at $1.1200 which has been holding over the past week has now been breached to the downside this morning. Momentum indicators which have been neutral over recent weeks are starting to edge lower. The RSI below 40 would be a signal of note, as it would be a near two month low. A close below $1.1180 would be a negative move which would then open the more considerable key lows at $1.1110 (the bottom of the five month trading range). With the overnight slide, the hourly momentum is taking on an increasingly corrective configuration. The band between $1.1200/$1.1225 is now resistance and unless this can be broken higher, the outlook will remain under pressure now.
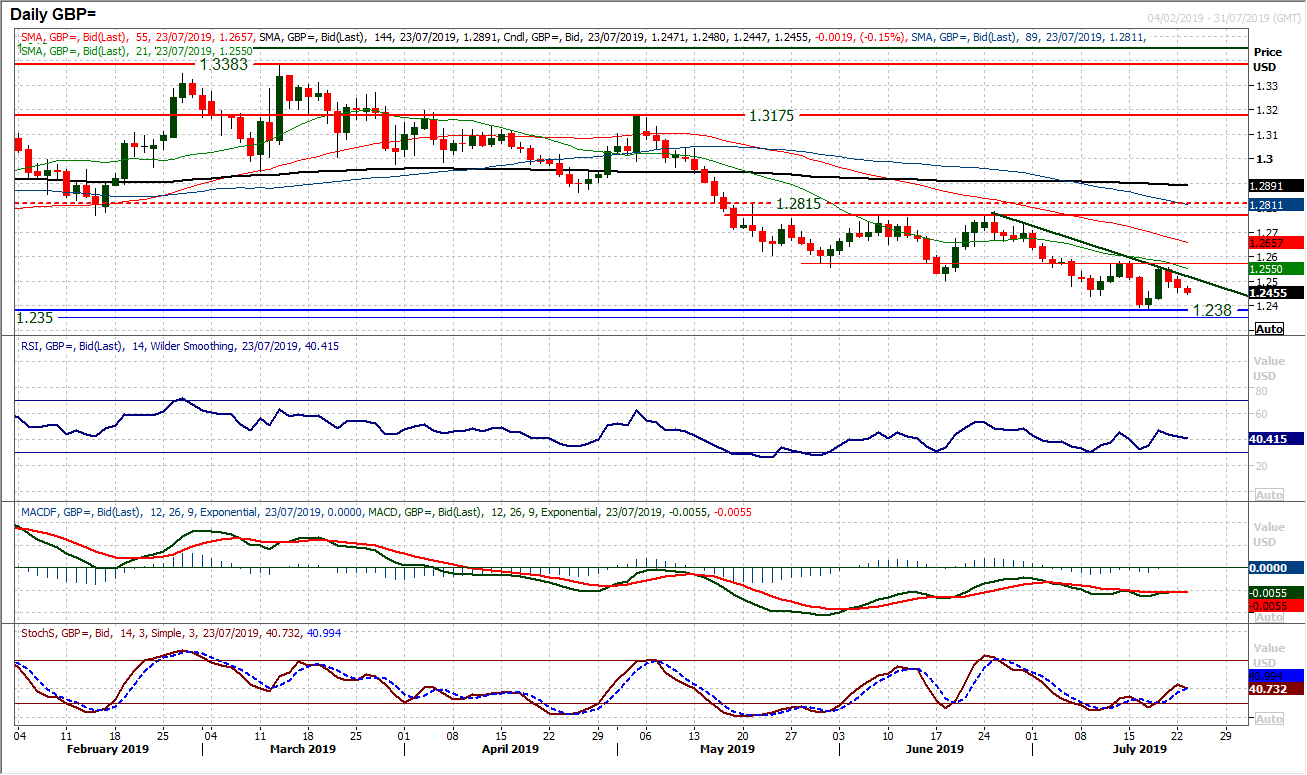
Normal services appears to have resumed on Cable. Rallies are a chance to sell. A downtrend of the past four weeks is providing the cap to intraday gains (today at $1.2520). A couple of negative candles in the past two sessions is leading to a continuation lower today as a combination of sterling underperformance and renewed near term dollar strength is pulling the market lower. Momentum indicators are rolling over again and the market looks to be preparing for a retest of the recent low at $1.2380. Last week’s reaction high at $1.2560 is looking increasingly to be another lower high (under $1.2580). The hourly chart shows that if the market positions below a near term pivot at $1.2455, it opens for the lows again. Initial resistance at $1.2510.
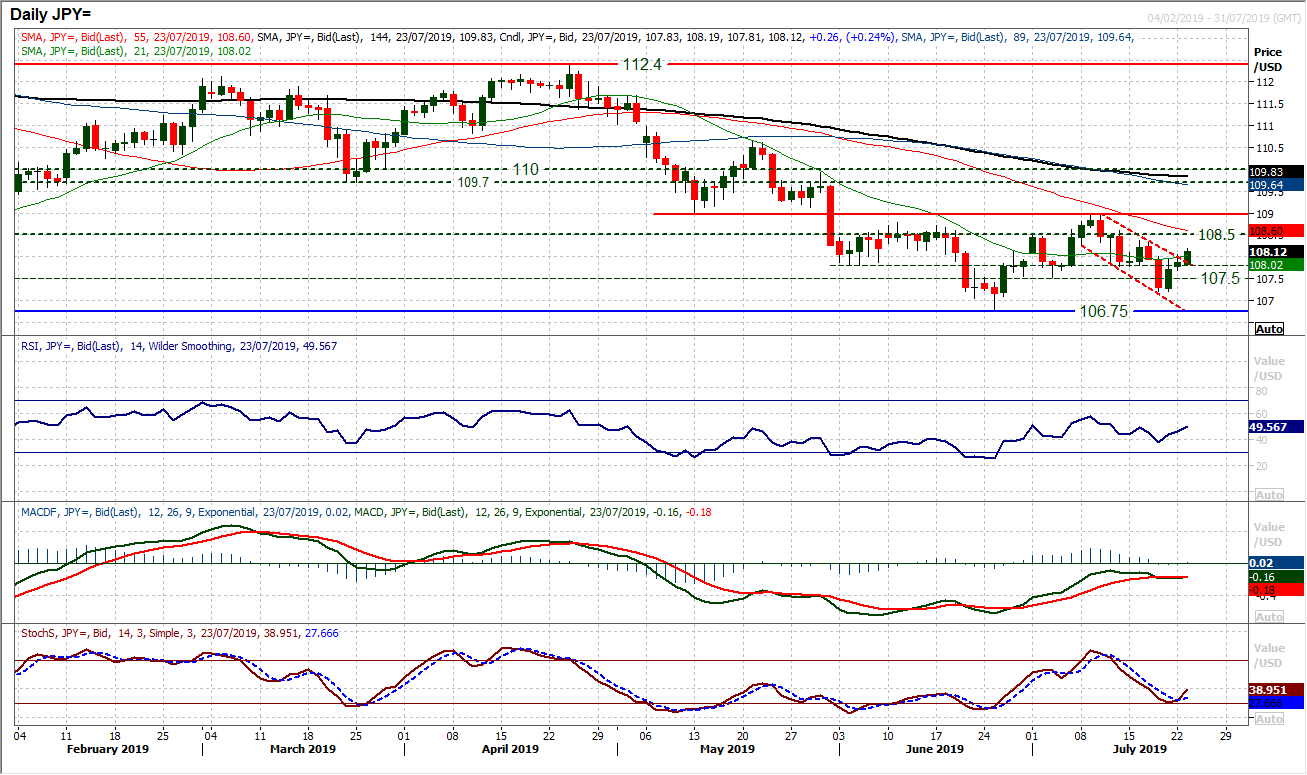
On a quiet session across forex majors, Dollar/Yen spent much of yesterday in consolidation mode. However, the dollar bulls have pushed on again this morning and are looking to rebuild an improving outlook once more. Breaking a mini downtrend channel, the bulls are making a move towards a test of the resistance from last week’s high at 108.35. The move in the past few sessions has removed the bears from a position of control within the 106.75/109.00 trading band. The key move will now be whether 108.35 can be overcome on a closing basis. If so then the corrective aspect of the range will have at least been put on ice, and potentially the market could be eying a base pattern again. This rebound now becomes an important move for the bulls. The hourly chart shows a more positive momentum configuration where the hourly RSI is holding above 50 and MACD lines above neutral. 107.80 /108.00 is becoming a basis of support initially.
Gold
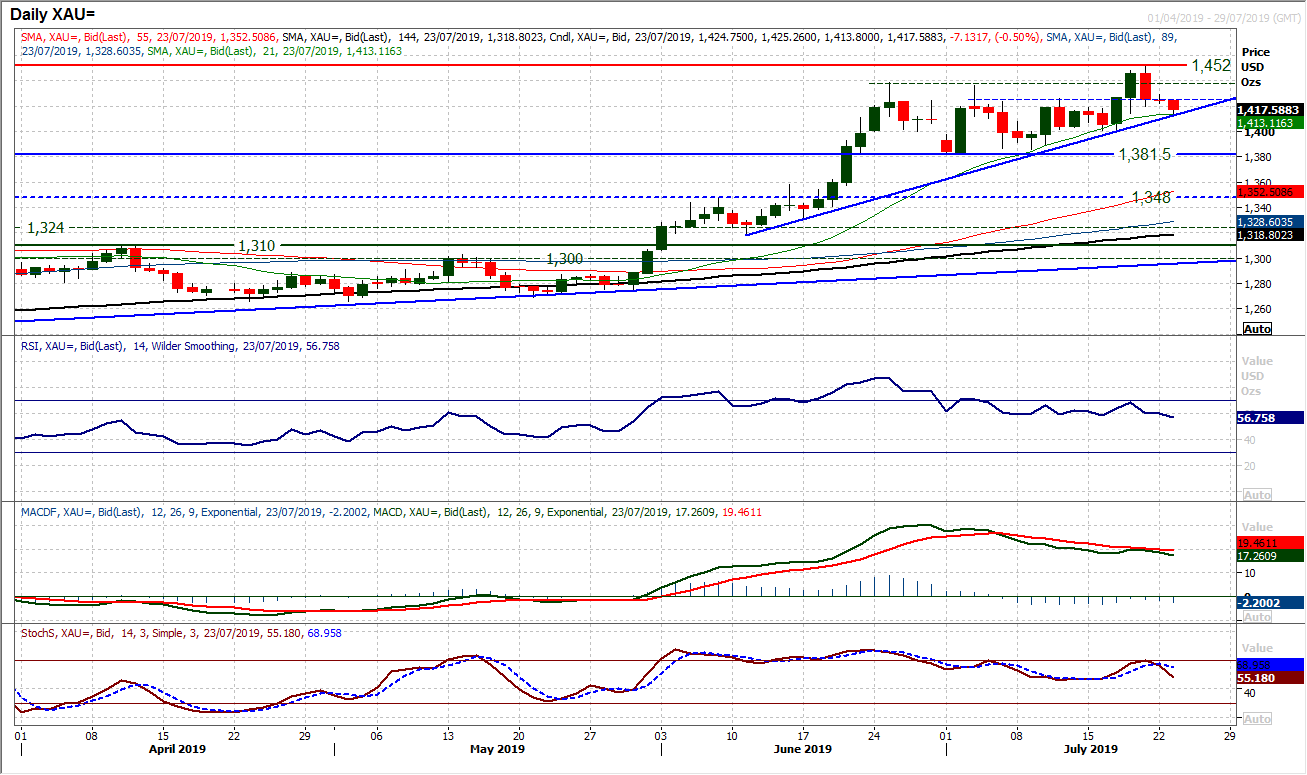
The difficulties of trading gold in recent weeks have been laid bare by the price movement in recent days. The bulls have taken a slap to the face as last Thursday’s decisive breakout to multi-year highs has been sharply reversed. Yesterday’s doji around $1426 support seemed to be the bulls hanging on to the breakout by their fingernails, but renewed selling pressure in today’s Asian session has put the European traders right on the brink of a key crossroads. The rising 21 day moving average (at $1413) has been the basis of support in the past couple of weeks. The support of a now six week uptrend (today at $1412) is also being tested as the market has fallen away today. The momentum indicators are also becoming a concern for the bulls. The unwinding move has been well contained in recent weeks, but the RSI has fallen below 60 for the first time in almost two months and the MACD lines have just bear kissed lower. The importance of the support at $1400 (pivot, psychological and also 16th July low) is crucial now to the whole outlook. For now this is a crossroads that the bulls can still cope with, but they need to react positively today. The hourly chart shows near term overhead supply between $1420/$1429.
WTI Oil
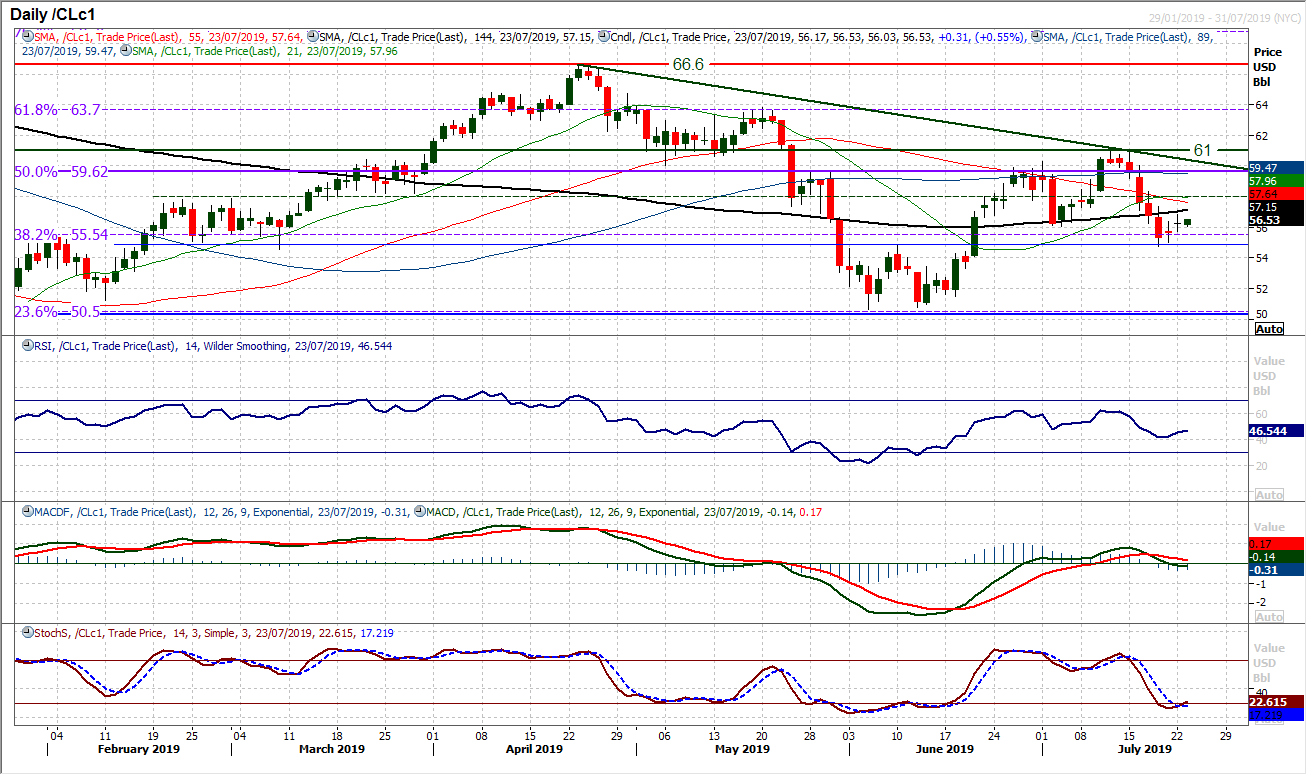
For the second successive session the bulls will have been left feeling disappointed. Although the market closed higher on the day, a perfect doji candlestick (open and close at the same level) implies uncertainty with the move. Last week’s closing breach of $56.05 signalled a shift in technical outlook to one of deterioration. With a new negative trend in formation now, rallies are seen as a potential opportunity to sell. The near term outlook has swung higher, but is an indecisive move where the bears are still a drag on recovery. The hourly chart shows that there is a near term bounce, but there has been no decisive technical improvement yet. The first lower high at $57.30 (which is also a near term pivot) is still intact, whilst hourly momentum indicators are rolling over too. A failed rally under the old pivot at $58.00 would be a concern for the bulls. Key support is at last week’s low of $54.70.
Dow Jones Industrial Average
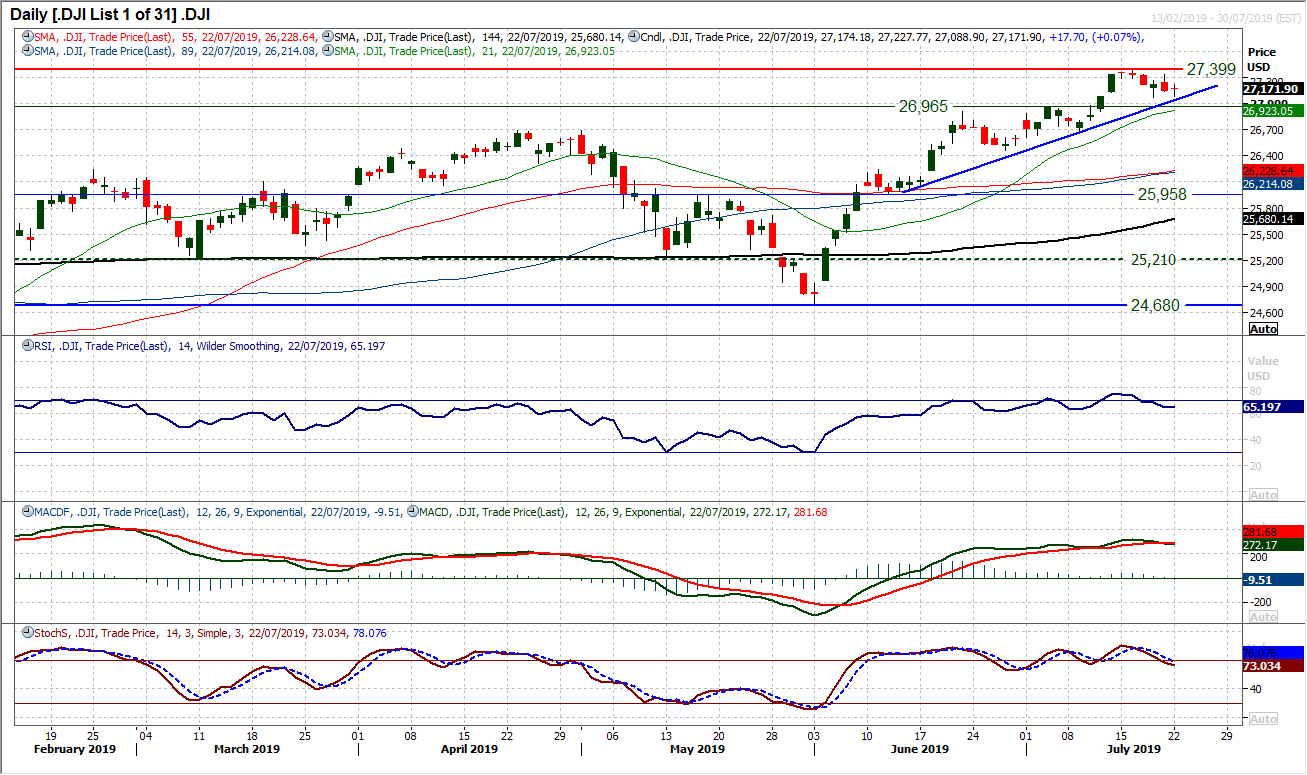
A day of quiet consolidation to begin the week. With a slight gain on the day and what pretty much amounts to a doji candlestick, traders are circumspect. The uptrend of the past five weeks is at 27,085 today and is a basis of rising support. All things remaining equal, the strength of the technical outlook should mean that this drift back to the uptrend becomes a buying opportunity. The Stochastics have drifted serenely back to an area where twice already in July, the bulls have found their feet again to leave higher lows. The RSI remains above 60 too. With the breakout support at 26,965 and recent low at 27,069 the bulls will still have eyes on a retest of the 27,399 all-time high as weakness should still be seen as a chance to buy. This only really changes on a breach of 26,666.


Leave a Reply
You must be logged in to post a comment.